In a world where regulation drives and defines all areas of market development, it is something of a surprise to find a traded asset class (or part of one) that has grown up largely through deregulation. Yet, this is the case in the utility markets; particularly electricity.
In the 1980s, significant regulatory changes moved the industry away from the vertically integrated structures that existed to more liberalised markets where producers and consumers had freedom to choose with whom they contracted. The US and Nordics, along with the UK, led the way. And with the deregulation came, quite naturally, the opportunity for exchanges to develop around these nascent markets.
A look at the power mix
Electricity production by source, World
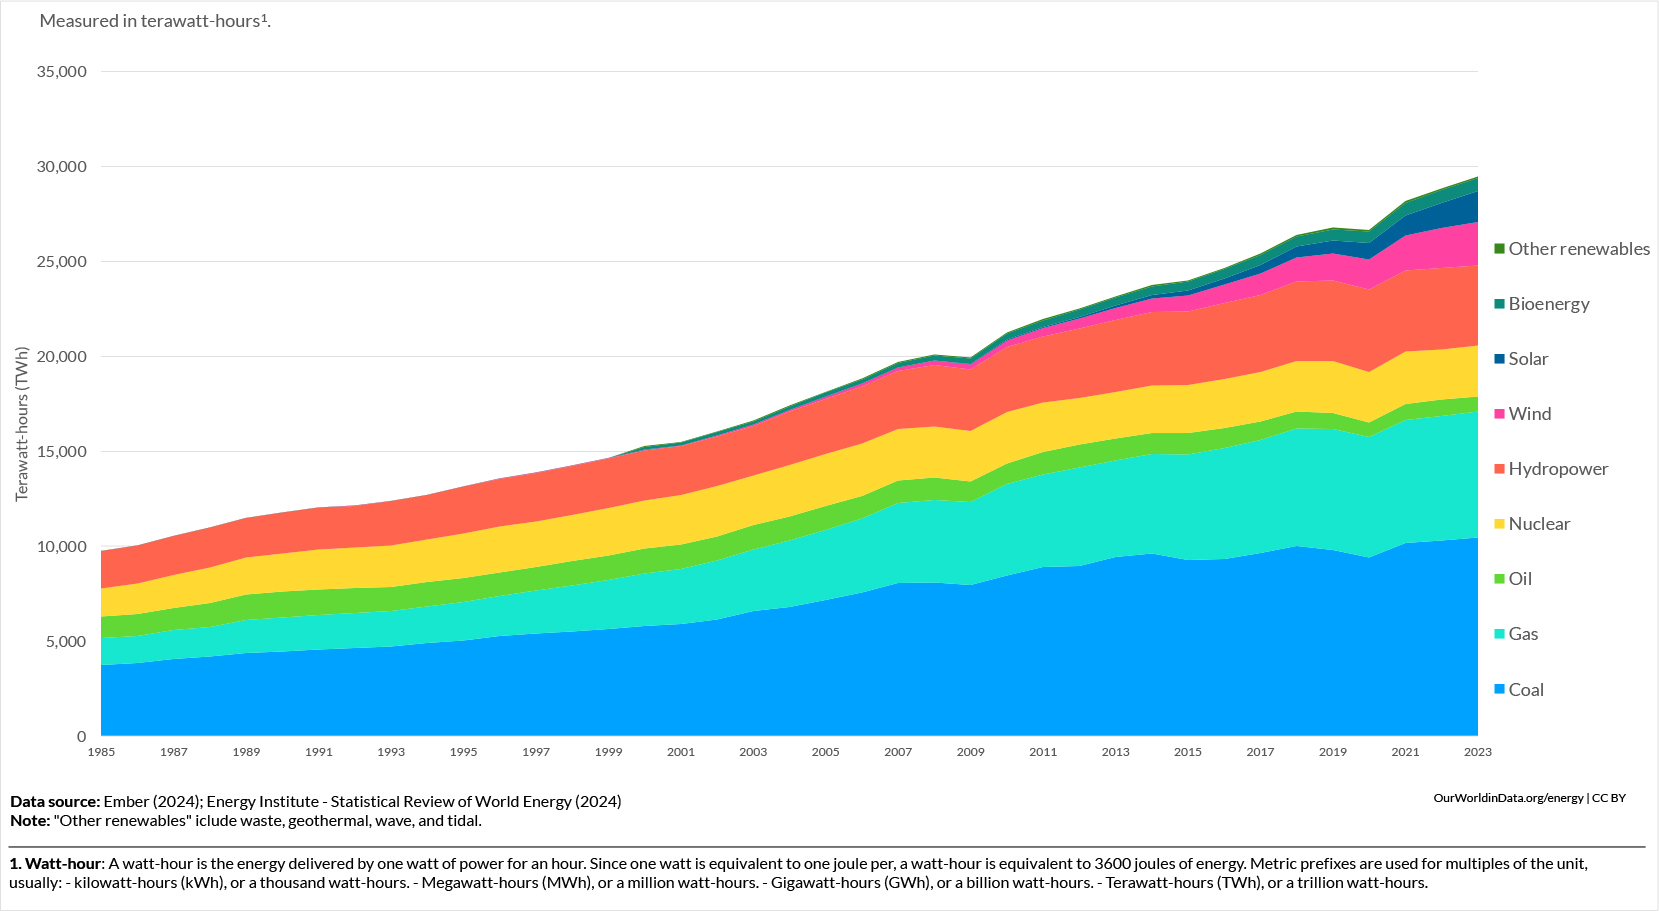
The chart above demonstrates this evolution of generation moving from solely hydrocarbons (natural gas, coal and some oil) to nuclear and hydro. From around 2000, renewables like solar, bioenergy and wind added to the mix. But more than two decades later, they have not shifted the dominance of hydrocarbons as the primary feedstocks for electricity production.
Despite the significant investment in and development of renewable generation, it only accounts for 16% of global generation by type, with hydrocarbons maintaining the lion’s share at 60%. And that 60% stranglehold represents only a 4% reduction since 1985, despite the discussions and action/inaction to address global warming and the much-vaunted energy transition.
The key change is, of course, demand. Generation volumes have all but tripled between 1985 and the end of 2023. This has created a race to keep the consumption supplied and led to the maintenance and development of hydrocarbon-based generation to accomplish it. In addition to the high-level growth statistics, asymmetric generation types in many countries present opportunities for traders in order to get a true picture of today’s diversified electricity landscape, not to mention trying to navigate it and benefit appropriately.
A few geographical examples help explain the 2023 generation figures. Whilst France generates 65% of electricity from nuclear power, 6.5% from hydrocarbons, 11% from hydro-electric and 16% renewables, its neighbour Germany maintains a higher level of hydrocarbon and renewable sources accounting for 41% and 49% respectively with renewables at 15% and hydro-electric at 4%.
In North America, the difference between the US and Canada is equally as marked for the same period, with the US generating a massive 60% of electricity from hydrocarbon sources compared to Canada’s 19%. Conversely, Canada’s 57% generation from hydroelectric dwarfs the US’s 5%.
Market complexities
Combining the different generation types with the ability to trade across borders, growing availability of battery/storage solutions and the near real-time granularity of delivery to the power grids makes the outcomes look somewhat bewildering. As J.C Kneale, vice president North American gas and power at Intercontinental Exchange puts it, “the number of potential [price] outcomes in the physical market due to intermittency is significantly greater than it has ever been and has driven volatility to new heights.”
There are now 36 power exchanges globally helping market participants manage this volatility, covering spot and derivatives.
Spot markets have developed significantly over the past ten years. The intricacy of the interconnected physical within-day and day-ahead markets has become such that algorithmic trading helps manage it. This algorithmic trading differs from the futures market by utilising algorithms to manage long or short exposures to each window for physical delivery close to real-time. Companies, such as Germany’s EsForIn, have led this innovation, managing multiple algorithms for diverse companies, each of which has (potentially) a 15-minute delivery window for each 24 hours of every day of the year.
Andreas Hoff, Trayport head of product, sums up the impact of algorithmic trading in the spot power markets succinctly. “We are now at a stage where it’s really hard to compete in spot power if you don’t have an algo.” Market participants estimate around 50% of all intra-day continuous traded power volume across Europe is now executed through algorithms. Some markets, like Germany, report significantly higher percentages, reaching up to 73% algorithmic trading volume on the EPEX Spot platform.
“We have also seen some high frequency traders entering the power market on the derivatives side, having started trading in natural gas derivatives markets,” Hoff continues.
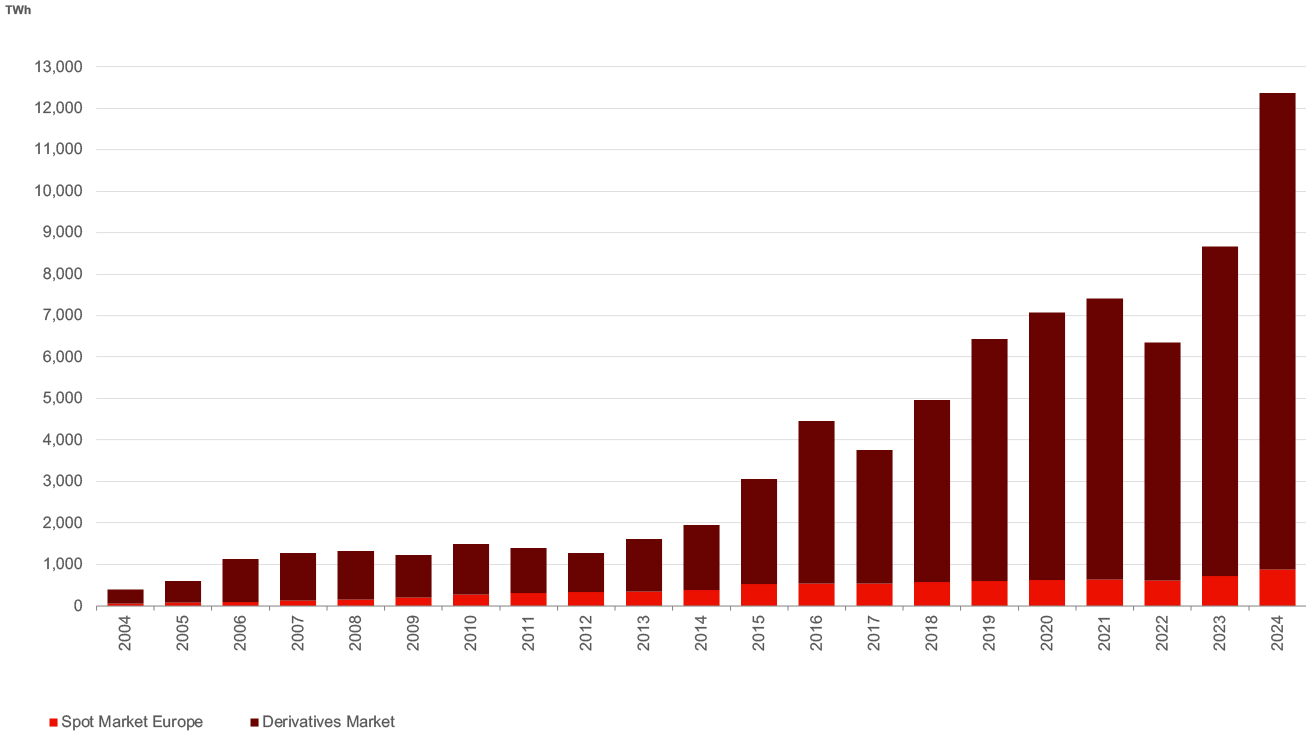
From a derivatives perspective, volumes have grown significantly as the chart below from the European Energy Exchange shows.
Trading volumes on the power spot and derivatives markets
Understanding the market growth
Peter Reitz, EEX CEO, comments on some of the reasons behind the growth in derivatives. “Clearing and credit risk are the key. When I took over as EEX CEO 13 years ago, the market was 90% OTC and 10% cleared. Now it is virtually the other way around.”
“The Russia/Ukraine conflict-fuelled energy crisis that started in 2022 saw the percentage of cleared volumes move from 60% to 80% in one year, and this volume has not returned to OTC.” ICE’s Kneale adds to this narrative. “The banks took over a market-making role post the Enron crisis, but with a number of them pulling back from the market following the financial crisis, the large merchant traders are now filling some of that risk-warehousing role – across the curve.”
The execution style of trading has changed, too, as Trayport’s Hoff explains. “These days, the vast majority is OTC-cleared or exchange-traded. Market makers provide liquidity on exchanges and brokers grow their coverage further out on the curve, in spreads and strips, as well as the options market.” These are key roles in a complicated landscape with the convergence of infrastructure development in the physical market and the need to source and lock in pricing for 10 years or more to make projects viable.
As one might expect, existing technology is also being leveraged to provide solutions for market participants. Trayport, with its historical strength in physical power markets, offers access to a broader product suite across the curve. Trading Technologies struck a different path by recently announcing NordPool connectivity to sit alongside its EPEX Spot connection that went live in February 2024.
Alun Green, executive vice president futures and options at TT, comments on this move. “We already have a close relationship with EEX, and the product and geographical expansion that our customers are driving made this move into other spot power markets entirely logical. What surprised us was the number of existing customers looking at moving into power or who wanted to consolidate their trading technology across the whole curve. The geographical and venue expansion that market participants are participating in makes the rationalisation of technology essential to drive efficiency”.
As Green alludes to, European competition is beginning to heat up with the recent announcement of the Euronext acquisition of the Nasdaq Nordic power futures business, but expansion for exchanges such as EEX and ICE is not limited to markets close to home. EEX has expanded its base with the March 2017 acquisition of the Nodal Exchange in the USA and extended its product coverage to Japan some five years ago, as has ICE with the launch of two Japanese power derivatives contracts in December 2024. EEX has also announced a joint venture with Brazil’s B3 to develop and launch a power market in Brazil, whilst Hoff notes “there are hints of things developing in India and Africa.”
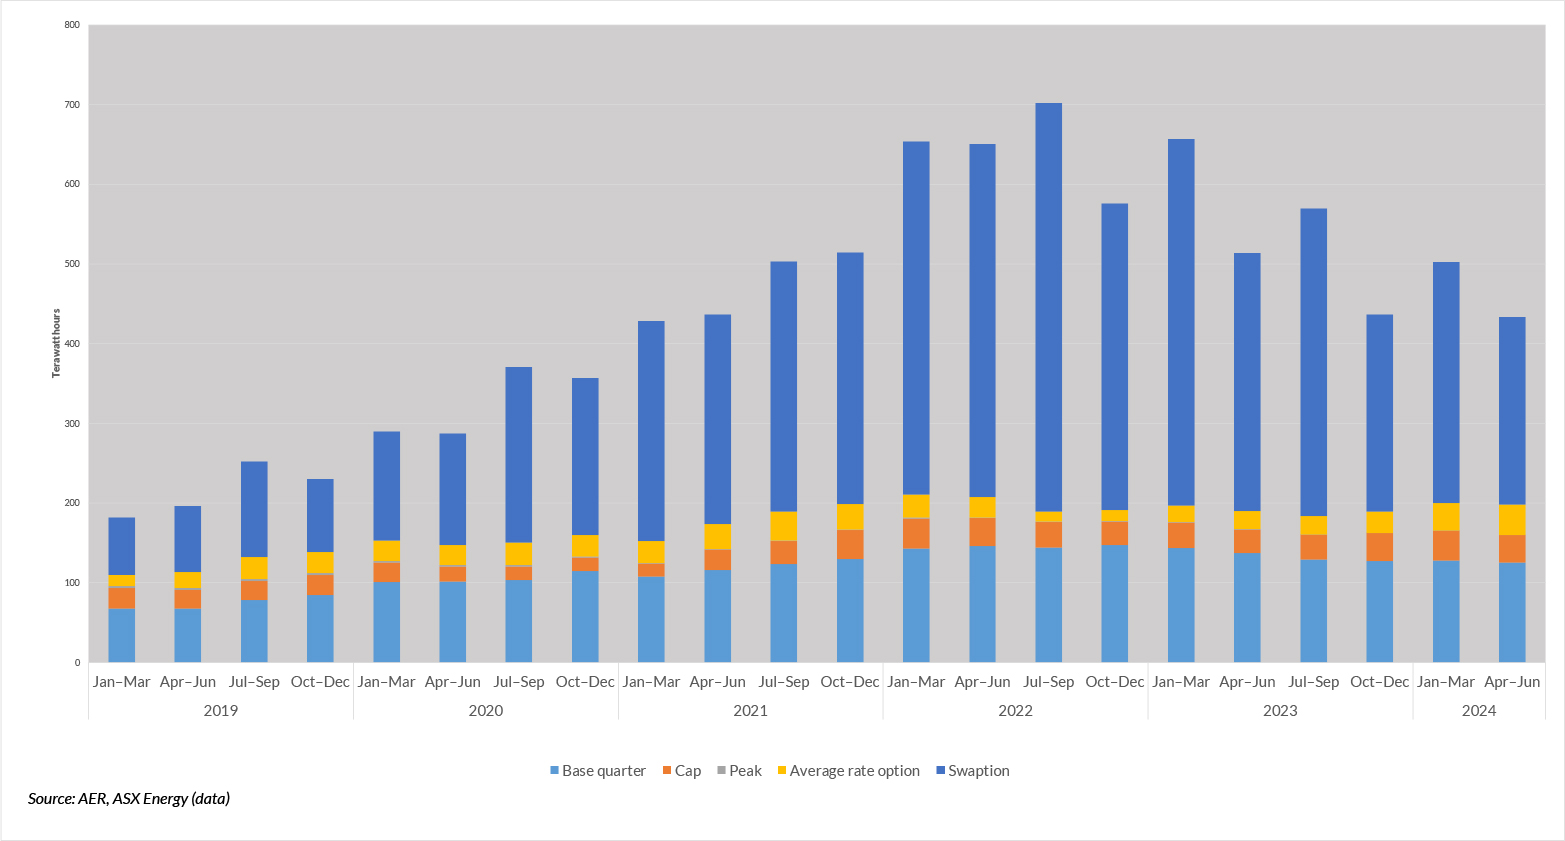
Australia, whilst a much smaller market by consumption than either France or Germany, also features on the interest list for both TT and EEX, with the former already present and the latter exploring opportunities. The incumbent in this market, the Australian Securities Exchange, has a successful power derivatives market in operation covering Australia and New Zealand.
Daniel Sinclair, general manager of markets at ASX, says the local market has developed meaningful liquidity. “The Australian market is characterised by a wide mix of market participants, and we have a number of liquidity providers who support the market and ensure the confluence of asset owners and liquidity. Support from commercial and government-mandated market making schemes has led to derivatives trading 5.5 times the underlying generation in TWh terms.”
The hydrocarbon-dependent Australian market now sees the growth of renewable generation and the intermittency that comes with it. This optionality of generation type provides fertile ground for financial options markets. Per the open interest chart above, ASX has found in developing its options market – a feat that eludes many other derivatives exchanges across many asset classes.
ASX open interest volumes
The past 30 years have seen a sea change in utility markets. None more so than power, which has stepped out from the shadow of its heavily traded cousin – natural gas – and begun taking on a life and profile of its own. Given the recent developments that have led to opportunities in these markets, the future looks bright.
And for good reason. Innovation is a hallmark of the development of power markets. As TT’s Green notes, “We should not underestimate the number of new, young traders entering the market who possess sophisticated technology skills.” These innovators see a market with so many moving parts by which they can apply and develop their skills and to see power markets expanding dramatically as a result.