Mapping the Flows from SEFs to CCPs
IN 2016, THE CFTC implemented new guidelines for data reported by swap execution facilities on their trading activity. Although those guidelines only applied to regulatory reporting, some SEFs have voluntarily adopted the new format for the daily files that they post on their websites. This new reporting format includes information on whether trades were cleared or not, and if cleared, which central counterparty was used.
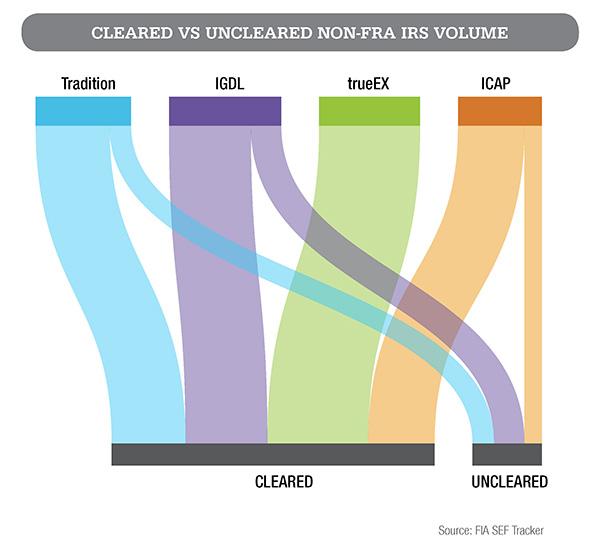
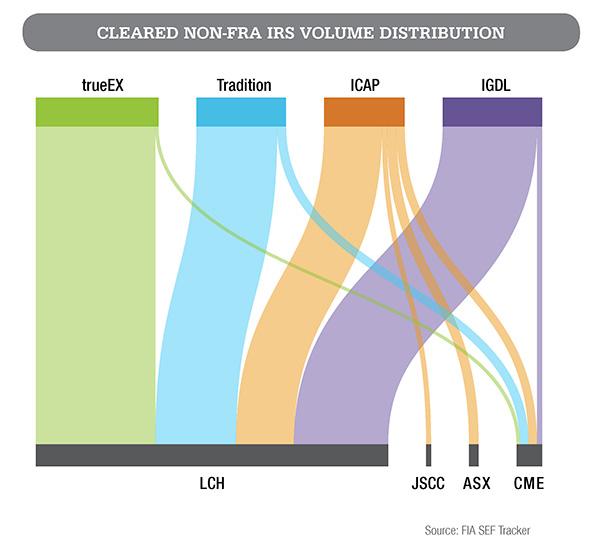
Currently six SEFs are publishing their daily volume files in the new reporting format: ICAP, IGDL, NEX, SwapEX, Tradition and trueEX. The availability of this new data sheds light on trends in the clearing of swaps and the linkages between SEFs and CCPs. To illustrate these trends, we decided to focus on interest rate products, the largest category of trading, and exclude forward rate agreements, most of which are traded on just two SEFs. We also limited the data to the month of July, the most recent available to us. Using this data, we created two charts, one showing the split between cleared vs uncleared volume, and the other showing the distribution of the cleared volume among the CCPs.
In the first chart, the top nodes represent the SEFs and the size of the nodes represent their respective volumes. The bottom nodes show the amount of cleared and uncleared volume coming from each SEF. The chart shows that more than 80% of the interest rate swaps traded on these venues were submitted for clearing. NEX and SwapEX are not included because they specialize on foreign exchange rather than interest rate products.
The second chart shows which CCPs are clearing these trades. LCH's SwapClear Service cleared by far the largest share with 73.9%, followed by CME Clearing with 5.4%, Australia's ASX with 2.0% and Japan's JSCC with 1.0%. The chart also shows that clients of ICAP submitted trades to all four clearinghouses, whereas the other three were linked to only two clearinghouses.