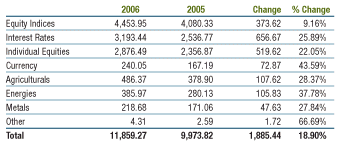
The number of futures contracts traded worldwide grew by more than 30% last year, setting yet another record along the way. Global options volumes were up more than 10%, and would have grown a lot more if Korea’s Kospi 200 stock index options—the 800-pound gorilla of this industry—had not lost a couple of pounds.
The total number of futures and options traded on exchanges around the world reached 11.859 billion contracts, according to the statistics collected by the FIA. That’s a tremendous number, but what’s even more remarkable is that the pace of growth actually seems to be accelerating. Last year’s total was 19% higher than in 2005, whereas 2005 was only 12% higher than 2004, and 2004 was just 9% higher than 2003.
While trading in commodity contracts grew relatively faster than in other markets, this is still a market dominated by financials. More than 90% of all trading in exchange traded derivatives is tied to interest rates or equity prices, and there is no reason to expect this to change any time soon.
The electronic revolution continues what now looks like a mopping up operation. Over the past year, most of the remaining open outcry exchanges began offering “side-by- side” electronic trading, and the last few are doing so this year. The effect of the changeover on their trading has been perfectly predictable. Trading volumes have exploded as screen trading unleashes latent demand for a wider range of customers and proprietary traders.
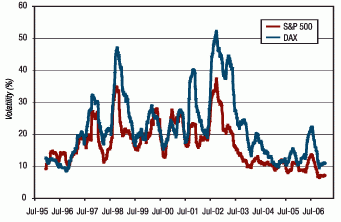
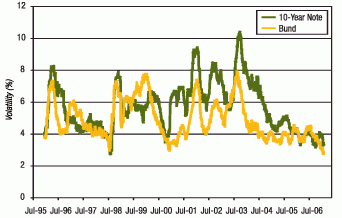
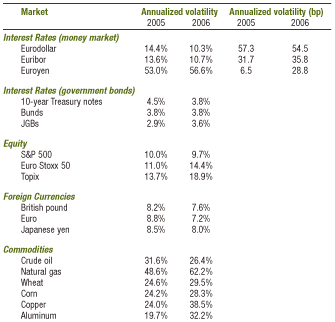
One of the biggest stories of the past year is in the huge growth of trading in Eurodollar futures and options. 2006 was the 25th anniversary of the listing of Eurodollar futures, and last year’s surge in growth is a testament to the force of their revolutionary power in the financial world. It is noteworthy that the growth in volume took place against a backdrop of stable to declining volatility in many of the most important markets.
This may be a good time to reflect on the influence that the electronic revolution has had on the costs of trading, and consider asking the exchanges to make drastic reductions in their minimum tick sizes. Now that the locals have been taken out of the equation of exchange decision-making, all major stakeholders— traders, hedgers, exchange shareholders, and brokers—would stand to gain enormously from such reductions. It would be a win/win/win situation.
It’s a Derivatives World
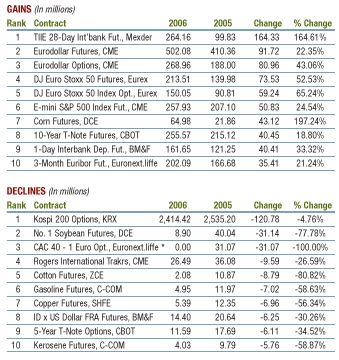
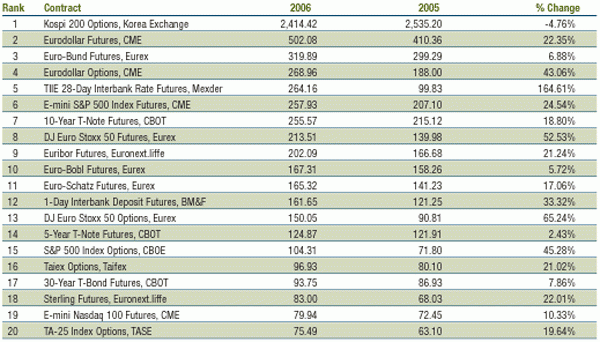
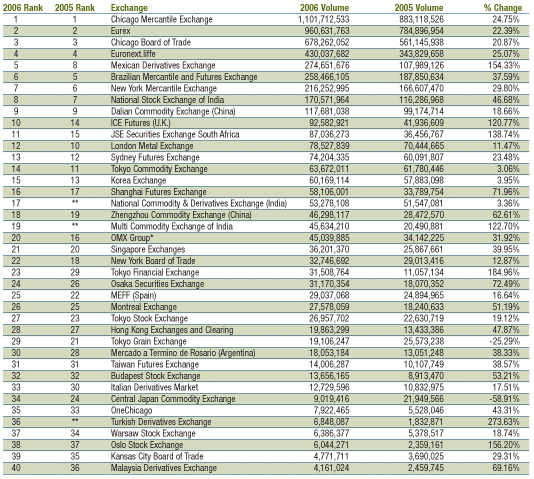
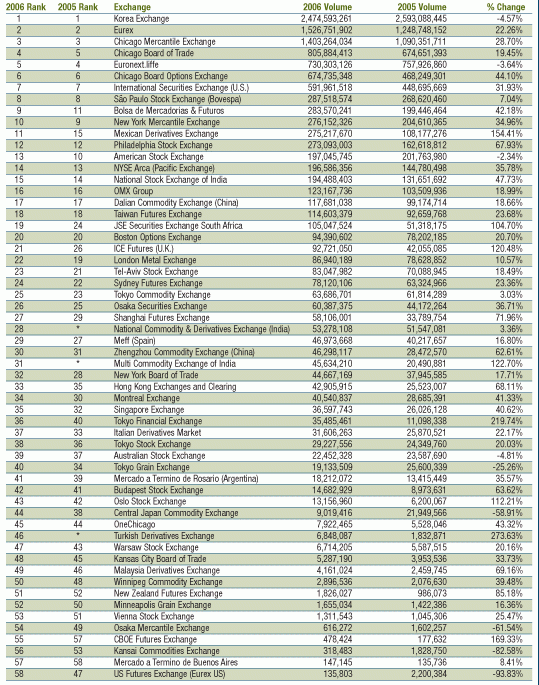
Looking over the FIA’s volume statistics, which are collected from approximately 60 exchanges, it is impressive to see how diverse this industry is. Every year it seems like another exchange from a previously unnoticed local market blasts its way up the volume ranking. This year’s hottest market has to be the Mexican Derivatives Exchange, which has struck gold with its short-term interest rate contract, the TIIE 28 futures. Farther down the ranks, South Africa’s JSE Securities Exchange more than doubled its volume in a single year, which moved it from the 24th to the 19th largest derivatives exchange in the world.
Some of these markets may turn out to be one-hit wonders, but on the whole the exchange landscape is much more diverse than just a few years ago, and too big to view from a single vantage point. There is certainly some correlation within categories. For example, we saw a big jump in the trading of equity index derivatives in lots of different markets during the broad stock market sell-off last May and June. But the factors driving volume in one category don’t necessarily carry over to another category, and even more so when you factor in geography. To put it another way, we are still looking at a collection of many separate markets, each with their own set of factors affecting volume.
Take for example the equity index business. The growth rate for this category was 9%, which makes it seems like it is lagging the rest of market. But if you break down that number, you find some wildly different trends. First and foremost, volume in the Kospi 200 option was down 5% year-overyear. The Kospi option is the single most heavily traded derivative at any exchange in the world, so even though the decline was not a big deal in percentage terms, the absolute impact flattened the entire category.
Another reason why the equity index volume appeared to be lagging was the decline in options trading at Euronext.liffe. During the past two years, the Euronext group’s Paris market changed the multiplier on its CAC 40 index options to 10 euros instead of one, and changed the number of shares underlying certain individual stock options to 100 shares instead of 10. In other words, the notional size of these contracts grew 10 times bigger, which means that the same position could be obtained by trading 10 times fewer contracts. So quite naturally the volume declined, but it would be wrong to conclude that this signals a decline in market activity.
Fortunately the people at Euronext.liffe have provided us with volume statistics adjusted for these changes in notional value, and sure enough the growth rate is much more in line with other markets of similar size. The exchange-wide growth rate was 21% using the rebased figures, compared with a decline of 4% using actual volumes.
Eurex Becomes an Equity Exchange
Something even more unusual is happening at Eurex, Euronext.liffe’s closest competitor. Several years ago, Rudi Ferscha, then the chief executive of Eurex, made some waves with negative comments about single stock futures. Just when the U.S. exchanges were falling all over each other to get into this business, Ferscha said he did not see any real demand for these products.
They certainly are singing a different tune these days in Frankfurt. Last year more than 35 million single stock futures were traded at Eurex, more than were traded at Euronext.liffe and second only to the National Stock Exchange of India, the world champion in this category.
Eurex is also having a lot of success with the rest of its equity products. People tend to think of Eurex as a German exchange, but all along it has anticipated the single market in Europe. Its Euro Stoxx 50 futures and options, which are pan-European rather than national in composition, are now the preeminent equity index contracts in Europe, at least in terms of volume. In fact both contracts rank among the largest and fastest growing contracts anywhere in the world, in any category. And Eurex has been very successful in volume terms in expanding its range of individual equity options to cover the blue-chip corporate names across Europe.
From a historical perspective, this is quite a transformation. What really put Eurex on the map was its success with interest rate contracts, and in particular its victory over Liffe in the battle of the bund. But all these equity products are growing so rapidly that our old friends the bund, bobl and schatz now make up less than half of the exchange’s total volume.
The Eurodollar Colossus
2006 was the 25th anniversary of the Chicago Mercantile Exchange’s launching of the Eurodollar futures contract, which may have done more to transform the world of applied finance than any other single stroke of innovation. At the time they were launched, the idea of zero coupon bonds was mainly an idea hatched in the minds of leading finance academics. The combined effect of Salomon Brothers’ stripping of the coupon off Treasury bonds and the listing of Eurodollar futures made them a practical reality.
Although the Federal Reserve was somewhat skeptical of contracts like these when they were first listed in 1981, Eurodollar futures have transformed the world of banking and made it a much safer and more efficient part of our financial machinery. A modern bank knows its yield exposure in terms of Eurodollar futures equivalents and can use the contracts for hedging interest rate risk with almost surgical precision. And the simple fact that long and short positions can be offset and removed from the books means that banks can do risk control all day long without bloating their balance sheets.
After 25 years, one might think that the market for this contract would have matured. But its growth last year suggests not. More than 500 million Eurodollar contracts were traded, or roughly two million contracts a day. This is equivalent to trading $2 trillion a day of three-month time deposits. After the Kospi 200 options, the Eurodollar futures contract is the second most actively traded contract in the world if measured only in terms of numbers of contracts. In portfolio equivalent value, it is by far the largest futures market in the world.
And the costs of trading are low. This market has become so liquid that it is possible to trade 1,000 of any of the “whites”— the first four contracts—and give up no more than .3 basis points in market impact. That is simply amazing.
And there’s more. Trading in options on Eurodollar futures grew more than 43% last year to just under 269 million contracts. This contract is now the fourth most actively traded derivatives contract in the world, right behind the Eurex bund futures contract. Average daily trading volume is just over one million contracts a day—the equivalent of options on $1 trillion in threemonth time deposits. Also astounding.
The Commodity Explosion
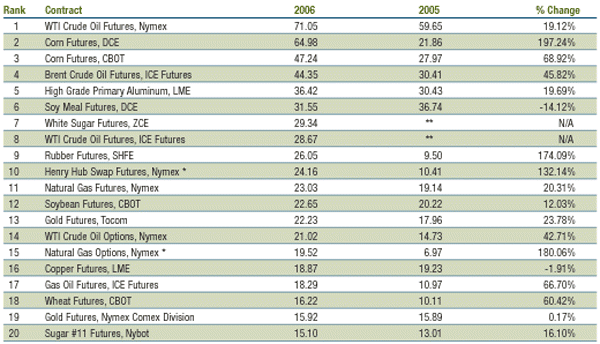
2006 was really a watershed year for everyone trading futures on physical commodities such as crude oil, copper and corn. Commodity markets in general were hot, hot, hot with institutional investors, and a lot of buying power came into the futures markets. We also saw the electronic trading revolution finally embraced by the North American commodity exchanges, including such stalwarts of open outcry as the New York Mercantile Exchange.
By the time this article appears in print, just about every commodity futures market in the world will be available to electronic traders, and without being curtailed to the midnight hours. And if the past is anything to go by, we should expect the volume to explode. Just look at what happened to the grain futures traded at the Chicago Board of Trade. Within five months after the CBOT introduced side-by-side trading in August, the corn, wheat and soybean contracts had passed the halfway point in the migration to the screen. Open outcry volume across all of the exchange’s agricultural contracts grew 23% year-over-year, but adding in the electronic volume pushed the growth rate to 40%.
The other part of the commodity story is taking place in Asia. We’ve known for some time that commodity exchanges in countries like China were becoming major players in the global commodity trade. But this year we have statistics from two Indian commodity exchanges for the first time, and their volume is roughly comparable to their Chinese counterparts. The National Commodity and Derivatives Exchange reported 53 million contracts in volume in 2006, not far off from the 58 million contracts traded at the Shanghai Futures Exchange. And India’s Multi Commodity Exchange and China’s Zhengzhou Commodity Exchange both traded around 46 million contracts, with Zhengzhou just slightly ahead.
Volume and Volatility
Volatility is often assumed to be positively correlated with derivatives trading volume, but last year’s surge in trading happened while volatility in the world’s most important markets was generally falling. We have never had a really good model of volatility and trading. On the one hand, a decrease in volatility takes away opportunities to trade and reduces the urgency of hedging. On the other, in light of the work we have done on measuring market liquidity, we know that a decrease in volatility produces a decrease in the costs of trading. It also increases the position sizes that speculators require to achieve any given level of volatility in portfolio returns.
Given this ambiguity about volatility and volume, the more or less steady growth of futures and options trading against a backdrop of large changes in volatility—both up and down—suggests that the forces behind the growth of exchange-traded derivatives are a lot more complex than just changeability of prices and interest rates.
This makes sense in a way. The financial futures industry is 30-plus years old, and by the standards of most of the (young) people in the business, quite mature. At the same time, not everyone who might benefit from using these instruments does. Many traditional money managers are wary of our markets. The worlds of accounting, regulation, and taxes do nothing to make our markets accessible to major coporations.
But the forces of lower trading costs, better credit, price transparency, and deep liquidity cannot help but make themselves felt.
Tick Size Analysis— A Win, Win, Win Situation
One of the distinguishing features of the futures market when compared with its overthe- counter cousins is the regulated minimum tick. When I came into the business, I was told that the minimum tick, together with scheduled expirations and well-defined deliverables, served to concentrate trading in a limited number of places along the real price line, the real time line, and the continuum of products. The minimum tick also may have reflected a certain amount of price protection for locals, who were members of the exchanges and the principal source of liquidity for the outside world.
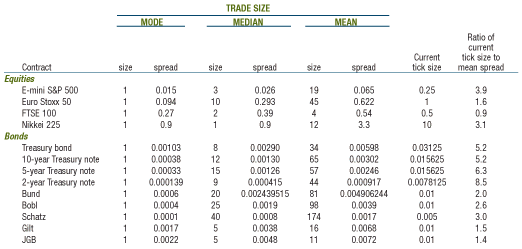
The table called “What Should the Tick Size Be?” shows the relationship between what the competitive bid/ask spread likely would be for trades of various sizes—the mode, the median, and the mean—for several equity index and government bond futures markets. These trade sizes were taken from the distributions of trade sizes for the fourth quarter of 2006. To determine the competitive bid/ask spread, we doubled the theoretical market impacts for trades of these sizes using our theoretical market impact model using trading volume and price volatility data for 2006. [For an explanation of our market liquidity model, see “Measuring Market Impact: Transaction Cost Analysis Comes to the Futures Market” in the November/December 2006 issue of Futures Industry.]
The current minimum ticks for each contract are shown in the next-to-last column in the right of the table. And in the right-most column, for the purposes of illustration, is the ratio of the minimum tick to what the bid/ask spread would be in the absence of this restriction. In all cases but one, the regulated tick is several multiples of what it would be if competitive trading forces were allowed to determine the bid/ask spread.
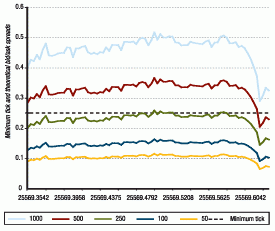
Consider E-mini S&P 500 futures. The table on page 22 compares the theoretical bid/ask spread for trade sizes ranging from 50 to 1,000 with the current minimum tick. As you can see, the minimum tick is a binding constraint for trades of 250 or less at almost all times of day. In the absence of the minimum tick, one can easily imagine a bid/ask spread of 0.1 or less, in contrast to the current 0.25.
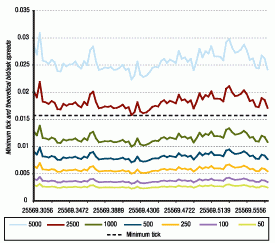
The current minimum tick is even more constraining in the market for 10-year Treasury note futures. As shown to the left, the current minimum tick of 0.15625 is a binding constraint for trades up to 1,000 or more. For trades of 50 contracts, the competitive bid/ask spread could easily be 0.025 (or whatever the goofy system of dividing 32nds by 2N might produce).
My most influential mentors in this business never failed to impress on me the importance of two things—the costs of trading and credit. The only two reasons we exist as an industry is that we provide a cheaper place to trade and much better credit than our overthe- counter competitors.
It seems to me that this would be an excellent time to take advantage of the fact that we are now almost entirely an electronic trading market and make the market yet more competitive. Who loses? No one I can see.
Now that most futures exchanges have become corporations rather than memberships and most futures contracts are electronically traded rather than pit traded, we have an opportunity for three major players to benefit from a reduction in tick sizes. By reducing the tick sizes dramatically, the exchanges can improve the lives of at least three important groups of people. The first and by far and away the greatest beneficiary would be those who trade. The bid/ask spread is the largest component of total trading costs—dwarfing brokerage and exchange fees—and for this group, the costs savings would be exceptional. The second would be the exchanges’ shareholders, who would experience a substantial increase in fee income generated by the extra volume that would be generated by lower trading costs. And the third would be brokers whose incomes are tied directly to trading and clearing volume.
|
|
|
|
|
|
|
|
|
|
|
|


