“Derivatives are the highest financial life form on the planet…” was the opening of my dust jacket endorsement of Chris Culp’s recent book, Risk Transfer. Derivatives in general, and futures in particular, represent a highly abstract way of trading. They are a way, as Rick Kilcollin taught me years ago, of separating the price from the product. And in so doing, we have found new ways of managing risk, improving the efficiency of financial markets, and reducing the costs of hedging and speculating. In all these ways, this industry over the past 30 years or so has transformed the worlds of banking, underwriting, and investment management. The financial world is less risky than it was in the 1970s and operates far more efficiently.
The reason I say this is that each year, when drafting this piece on growth in the futures and options industry, I look for some lesson that will refresh my appreciation for the business we are in. This year, after so many years of spectacular growth, everything was beginning to look the same. But a remark by Megan McGregor in her January/February article on growth in futures trading caused me to look at the world with a fresh eye.
McGregor was struck in particular by the robustness of exchanges in Mexico and South America. Those exchanges are but a few examples of the spread of futures trading into parts of the world that have been working hard to gain a serious foothold in global financial markets. Not only are there active markets throughout the Americas, there are active futures exchanges in Eastern Europe and a number of exchanges popping up throughout Asia. To see this, simply run your eye down the list of the Top 40 Futures Exchanges (page 42).
I view the spread and growth of futures exchanges throughout the world as a really good thing, and not just because it affords me opportunities to teach in new and interesting places. Rather, the appearance of a successful futures market is the most obvious sign that a country has made it to the highest level of financial sophistication. And so, while we are eking out our livings in this industry, we can take some satisfaction from knowing that we are part of an industry that is making the world a better place.
Patterns of growth in 2004
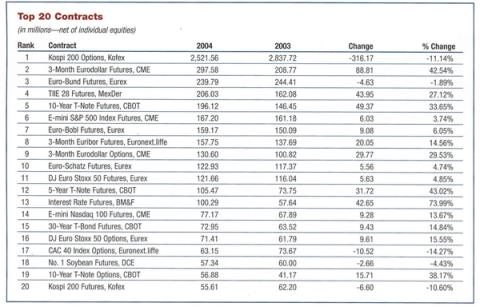
The accompanying summary tables afford a broad range of perspectives on growth in futures and options trading in 2004. Overall, total contract volume was up nearly 9%, and this against a backdrop of generally falling price volatility. Also, by looking at the individual sectors, growth was fairly strong across the board. The main exception was a drop in equity index trading, which can be explained entirely by a drop of 316 million in Kospi option volume. Not that one should pick and choose how to look at growth, but if we exclude this big swing in Kospi activity, growth was about as strong abroad as it was in the U.S., and growth in options trading was about as strong as growth in futures trading.
The influence of a contract like Kospi options on our volume and growth measures is huge. Kospi option volume represents nearly 28% of total global contract volume, so when it gains or loses a large amount of volume, the effect can obscure the health of the rest of the industry. For example, if we were to net out trading in these options, we would find that total contract volume grew 1,040 million contracts rather than 724 million. The percentage growth in options volume would have been 23.9% rather than 4.6%, and the growth in total contract volume would have been 19.5% rather than 8.9%. Of course the flip side of netting out Kospi options trading is that they were responsible for the really hefty growth rates we have seen over the past three or four years.
Some of the spectacular accomplishments were in the equities and interest rate markets, which are the real backbone of the industry. Options trading in individual equities increased 28%, while trading in interest rate futures and options increased 21%. Trading in forex contracts grew fastest of all, but on a very, very small base. This much growth in trading is all the more remarkable because it happened in a year when market volatilities were falling, not rising.
Commodity trading, except for precious metals, increased substantially as well. Within this sector, there was very healthy growth in ags, energies, and non-precious metals. Energy trading was up 12% worldwide, not surprising in light of the whipsaw in energy prices last year. Trading in copper, lead and other non-precious metals was up by 16%.
Waves of growth since 1984
In 1984, total trading volume was 188 million contracts. In 2004, contract volume reached 8.9 billion contracts a year. This represents an average annual growth rate of 21% for the past 20 years. At this rate, trading volume doubles every 3.5 years or so.
The human eye is always looking for patterns, and to my eye, it seems as if this growth has come in three waves over the past 20 years. The first in this history runs through the 80s, with a big growth spike in 1987. The second could be placed in the first half of the 90s, with a big growth spike in 1993. The third and most recent runs from 1997 on, with its highest growth rate occurring in 2001.
The main forces behind the first and second waves included the introduction of money market and equity futures contracts, the growth of the swaps market, the introduction of options on futures, and the adoption of all of these instruments by new exchanges abroad. The most recent wave seems as if it has been driven by a fresh round of expansion of trading into a new set of markets and by the invigorating effects of electronic trading. For students of technological change, the growth of futures and options trading during these years looks very much like what one would expect from the diffusion of a new and attractive technology.
Electronic trading
The electronic revolution in trading is nearly, but not quite, complete. I find it interesting that U.S. exchanges, which pioneered the business of financial futures trading, have been the slowest to make the shift from open outcry trading on physical trading pits to trading on electronic platforms. But the shift to electronic trading has been good for trading volumes in Chicago. The E-mini equity futures contracts have been a source of real growth for Chicago Mercantile Exchange, and has actually breathed some new life into the trading of forex futures, which for two decades had been the incredible shrinking market.
The greatest impact, though, has been in interest rate trading. Of the 10 largest increases in contract volume in 2004, eight were interest rate contracts. Of these, the fastest growing contracts were Eurodollar futures and 10-year Treasury note futures. That is quite remarkable, given that both contracts are well-established and interest rate volatility was lower than the year before.
I would like to think that the upsurge in Eurodollar trading was because of my new Handbook of Eurodollar Futures and Options, but I think it is more likely a consequence of CME forcing Eurodollar trading onto Globex in response to potential competition from Euronext.liffe. The ratio of Eurodollar trading done electronically went from under 10% in January to more than 70% by December. That is a spectacular accomplishment. At the same time, the Chicago Board of Trade felt the hot wind of competition from Eurex and finally eliminated the punitive fee for trading electronically. The CBOT also changed electronic platforms, adopting Liffe Connect in lieu of its original a/c/e system. I don’t think it was a coincidence that contract volume was up 34% in 10-year note futures and 43% in 5-year note futures. In Eurodollar futures, total volume was up 43%.
Another possible impetus for the growth in interest rate trading in Treasuries and Eurodollars is the practice of clearing these trades at the same clearinghouse. The practice of common clearing greatly reduces the capital required to trade intermarket spreads.
Last year, I took a look at the relative velocity of trading in various futures markets (as measured by the ratio of contracts traded to open interest) and found that trading in Eurobund, bobl, and schatz contracts was about twice as fast for any given level of open interest as was trading in Treasury futures. This year, two things of interest have happened. First, trading velocity in both markets has fallen, which means that open interest has grown relatively faster than has trading volume. Second, the gap in trading velocities has narrowed. For Eurobunds, the ratio of daily volume to year-end open interest was 1.2 in 2003 and .80 in 2004. For the 10-year Treasury note contract, these ratios were .62 in 2003 and .49 in 2004. It will be interesting to see if trading velocities in the two markets converge more next year
Another way to look at the drop in relative trading velocity of the Eurobund contract is that volume was roughly flat, but open interest increased almost 50%. Because open interest is a good measure of how much longer term risk people want to take, or avoid, using the contract, this growth in open interest could well be a new phase in the maturity of the European bond market.
Stock option trading
One of the other big drivers for the growth in global trading volume in 2004 was the surge in the trading of equity options. 2004 was a great year for options on stocks both in the U.S. and abroad. Total volume was up by 28%, almost double the rate of the year before.
In the last few years, the main trend, at least among the U.S. options exchanges, was a battle for market share in a market that was not growing very fast, if at all. The International Securities Exchange, the only all-electronic options exchange until the formation of the Boston Options Exchange in 2004, was doing great business, but mainly at the expense of the other exchanges.
This year, in contrast, the rising tide is lifting all boats. All five of the incumbent exchanges had double-digit gains in volume, and there was still room enough for BOX, the new exchange on the block, to enter the business with a flourish. BOX’s first year volume was 20.7 million contracts, more than three times Eurex US and 10 times OneChicago.
What drove the increased volume? Partly it seems to be related, once again, to the diffusion of electronic trading. ISE’s volume grew by an amazing 47% in 2004, much faster than any of the other incumbent options exchanges, all of which rely to some degree on open outcry. But there seems to be a larger trend at work. The options exchanges say they are seeing more trading by institutional investors, who for various reasons have become more willing to use options. This isn’t just a hedge fund phenomenon. Even relatively conservative institutions are using options strategies to enhance the returns on their equity portfolios.
Growth in equity options trading also took place in Europe. In fact, equity options were among the most robust parts of the business for both Eurex and Euronext.liffe. Stock options trading was up 12% at Eurex and 16% at Euronext.liffe on a year-over-year basis.
Commodity trading advisors
Whatever your views on alternative investments as an asset class, this sector of the asset management world has grown tremendously over the past several years, and CTAs have shared in this growth. Over the past two years, for example, their assets under management have increased from $51 billion to nearly $132 billion, according to Barclay Group.
To see how this might affect futures and options trading, consider that a comparatively active CTA might trade 600 round turns per million dollars under management each year, which would translate into 1,200 contracts or sides per year. An increase of $80 billion under management would, at this rate, lead directly to an increase in trading volume of 48 million contracts a year. On top of this, you might add two times that amount to represent the indirect effect on trading by market makers and locals. All told, this sector might have produced an increase in trading volume of around 144 million contracts a year.
CTAs will trade anything that moves, and any diversified trading program will include futures and options on physical commodities as well as on financials. Commodity trading really took off in 2004, and it would not be surprising if the growth in money managed by CTAs contributed a great deal to that trend.
Agricultural futures and options had a particularly good year. At the New York Board of Trade, for example, the total number of agricultural futures and options contracts rose by 27% in 2004 to 28 million contracts. It was the same story at the Chicago Board of Trade. Looking just at the exchange’s agricultural contracts, volume was up 17% to 85.1 million contracts. Same story again at Tokyo Grain Exchange, where total volume rose by 18% to 25.7 million contracts in 2004. And same story again with Euronext.liffe, where trading in agricultural futures and options rose by 21% to 8.0 million in 2004.
One interesting pattern in this trend is that the most liquid products also tend to be the fastest growing. Sugar futures and options, two of the Nybot’s top products, accounted for more than half of the increase in volume last year. Corn futures and options drove more than two-thirds of the increase in the CBOT’s agricultural complex. At TGE, soybean futures, its largest contract, had the fastest rate of growth at 48%. Likewise, robusta coffee futures and options, the most actively traded commodity at Euronext.liffe, drove almost two-thirds of the increase in that exchange’s agricultural complex. This increase in liquidity in the most active contracts was welcome news for CTAs, especially the large CTAs receiving big flows into their funds.
Second, all three of these exchanges experienced a strong increase in options trading. At Euronext.liffe, for example, trading of coffee futures was up 32%, quite a high figure until you look at what happened with the futures options, which were up 74%. At the Nybot, sugar futures volume was up 37%, while the options were up 69%. This probably reflects the increasing volatility of commodity prices in 2004 and suggests an increasing sophistication on the part of both hedgers and speculators.
A third trend is the growth in commodity futures trading in Asia, which harkens back to the theme of global growth that I brought up at the beginning of this article. One of the remarkable stories of 2004 is the re-emergence of futures exchanges in countries like China. If we look at the top exchanges in the area of agricultural futures, China’s Dalian Commodity Exchange is running neck and neck with the CBOT in terms of both size and rate of growth. The CBOT has a wider range of products, but DCE has the two most actively traded agricultural futures contracts in the world, both based on soybeans. At the moment, DCE is purely a domestic market, but over time that is likely to change. There also seems to be a lot of untapped potential. The new corn futures contract that DCE launched in 2004 did very well, with volume of more than 5.8 million contracts by year-end. It’s not hard to see why the CBOT is spending so much time building alliances in Asia.
The importance of costs
If we ever needed yet more evidence that costs are important to futures traders, the fairly stable mix of business between trading in the standard S&P 500 contract (whose dollar multiplier is $250) and the E-mini S&P 500 contract (whose dollar multiplier is $50) is a perfect example. Even though a trader has to do five E-mini contracts to achieve the financial equivalent of one regular contract, the bid/ask spread for the E-mini typically is smaller than it is for the regular contract. As a result, for those who simply want to trade the contracts, it is cheaper to trade five E-minis than it is to trade one big contract.
On the other hand, for those who maintain large open long or short positions that must be rolled every quarter, it is cheaper to roll positions in the regular contract than in the E-mini. This is because the bid/ask spread for the roll, or calendar spread, is equally tight in both markets. As a result, each has a cost advantage over the other for a particular type of trader, and the regular pit traded contract has maintained a sizeable market share.
Algorithmic trading
An emerging companion to electronic trading is algorithmic trading, which is nothing more than trading based on computer programs written to take advantage of the great flows of information that are now available via electronic trading platforms.
This may be one of the few areas in which futures trading has lagged behind the equity trading industry, where algorithmic trading and execution has been a key ingredient for years.
The possibilities for our industry are really quite extraordinary. Computer programs can be written to make markets, to discern price and quantity patterns, to hedge cash portfolios, and to do all of these things more easily in many ways than is now possible for human traders.
Fully, or even partially automated trading, represents a further step in the improvement of these markets for their users. One of the main driving forces behind the success of futures trading is that it represents a cheaper way to trade than one can usually find in related cash markets. In time, the business we do will be done with fewer people and at a lower cost.
Clearing OTC products at Nymex
A notable innovation at Nymex has met with great success. As Will Acworth described in his article on OTC energy clearing in the Jan-Feb issue, Nymex has begun to clear a broad range of over-the-counter energy products on the exchange by converting swaps into the equivalent of futures contracts. More than 13 million OTC contracts were cleared in 2004, making it the fastest growing line of business at Nymex. (Note: FIA volume data includes these contracts because they are cleared by futures commission merchants, they are held at the Nymex clearinghouse, and most importantly, they are converted into futures.)
I can only imagine how grateful energy traders are to the exchange for this new service. The collapse of energy trading markets that followed the collapse of Enron was a real shame, and the success Nymex has had in clearing these contracts is a solid testament to the importance of the clearinghouse and the way the futures industry manages risk.
Welcome to the Top 10
The center of gravity in trading has not shifted away from the Atlantic Ocean just yet. The largest seven of the top 10 exchanges, measured by futures-only volume, are either in Europe or some part of the Americas. The next three, however, are in China (Dalian Commodity Exchange), Japan (Tokyo Commodity Exchange), or India (National Stock Exchange of India). Of these, the National Stock Exchange of India is new to the top 10.
Also, in terms of sheer contract growth, nine of the 10 largest increases in trading volume were either in Europe or the Americas. Taiex options at Taifex, however, made their way onto the list, which is a great achievement for a comparatively new exchange. That said, growth in Asia is not just one long string of successes. The Shanghai Futures Exchange’s rubber futures contract dropped from 27 million contracts traded in 2003 to just under 10 million in 2004, a drop of 64%.
With all the attention on Asia, it is easy to overlook the fact that two out of the top 10 futures-only exchanges are based in Latin America. The Mexican Derivatives Exchange, which has only been operating for a few years, grew 21% to 210 million contracts traded in 2004, making it the fifth largest exchange on that list. Its leading contract, the TIIE 28-day interest rate futures, was the fourth most actively traded derivatives contract in the world. The Brazilian Mercantile and Futures Exchange, which has been around for a much longer period of time, had a tremendous year, with volume up 52% to 183 million. And if we add Bovespa, which traded 235 million equity options contracts in 2004, we have in Latin America three out of the top 11 futures and options exchanges worldwide.
Failed experiments
Oscar Wilde once described second marriages as triumphs of hope over experience. In fact, one of the things that make us human is our willingness to be governed by hope rather than discouraged by failure. This is especially important in futures markets, where relatively few ideas have really taken hold. We should not be discouraged, then, to see that two recent efforts have come to very little. Swap futures and mortgage agency futures have just about faded from sight. And single stock futures, at least in the U.S., have made no real progress since they were first listed in the fall of 2002.
This does not mean that exchanges will stop trying to find new things to trade. They must not. At the same time, it looks like the best opportunities for the futures and options world will be in doing the same old things in more countries and at a lower cost.
| GLOBAL FUTURES VOLUME | |||
| (In millions) | Jan-Dec 03 | Jan-Dec 04 | % Change |
| U.S. Futures | 1,042.97 | 1,324.03 | 26.95% |
| Non-U.S. Futures | 1,952.48 | 2,163.53 | 9.75% |
| Total Futures Volume | 2,995.45 | 3,487.56 | 16.43% |
| GLOBAL OPTIONS VOLUME | |||
| (In millions) | Jan-Dec 03 | Jan-Dec 04 | % Change |
| U.S. Options | 1,129.55 | 1,471.18 | 30.06% |
| Non-U.S. Options | 4,012.63 | 3,901.94 | -2.76% |
| Total Options Volume | 5,142.18 | 5,378.95 | 4.45% |
| Grand Total | 8,137.63 | 8,866.51 | 8.96% |
| FINANCIALS OR NON-FINANCIALS? | ||||
| (In millions) | Jan-Dec 03 | Jan-Dec 04 | % Change | Volume Change |
| Financials | 5,918.29 | 6,152.05 | 3.95% | 233.76 |
| Non-financials | 658.51 | 711.16 | 7.99% | 52.65 |
| Total | 6,576.80 | 6,863.21 | 4.35% | 286.41 |
| INTEREST RATES, EQUITIES & CURRENCIES | ||||
| (In millions) | Jan-Dec 03 | Jan-Dec 04 | % Change | Volume Change |
| Equity Indices | 3,959.17 | 3,775.43 | -4.64% | -183.74 |
| Interest Rates | 1,881.27 | 2,271.25 | 20.73% | 389.98 |
| Currency | 77.85 | 105.37 | 35.36% | 27.53 |
| Total | 5,918.29 | 6,152.05 | 3.95% | 233.76 |
| AGRICULTURALS, METALS & ENERGIES | ||||
| (In millions) | Jan-Dec 03 | Jan-Dec 04 | % Change | Volume Change |
| Agriculturals | 286.10 | 301.91 | 5.53% | 15.81 |
| Metals | 154.85 | 165.79 | 7.06% | 10.94 |
| Energies | 217.56 | 243.46 | 11.90% | 25.90 |
| Total | 658.51 | 711.16 | 7.99% | 52.65 |
| GLOBAL FUTURES AND OPTIONS VOLUME | |||
| (In millions) | Jan-Dec 03 | Jan-Dec 04 | % Change |
| Equity Indices | 3,959.17 | 3,775.43 | -4.64% |
| Interest Rate | 1,881.27 | 2,271.25 | 20.73% |
| Individual Equities | 1,560.17 | 2,002.43 | 28.35% |
| Ag Commodities | 286.10 | 301.91 | 5.53% |
| Energy Products | 217.56 | 243.46 | 11.90% |
| Foreign Currency/Index | 77.85 | 105.37 | 35.36% |
| NonPrecious Metals | 90.39 | 105.23 | 16.42% |
| Precious Metals | 64.46 | 60.56 | -6.05% |
| Other | 0.66 | 0.86 | 30.41% |
| Total Volume | 8,137.63 | 8,866.51 | 8.96% |
Top Ten Agricultural Futures Contracts
Based on Volume of Contracts Traded in 2004
| Contract | Exchange | 2004 Volume | % Change from 2003 |
| No. 1 Soybeans | DCE | 57,340,803 | -4.43% |
| Soy Meal | DCE | 24,750,958 | 65.52% |
| Corn | CBOT | 24,038,233 | 25.73% |
| Soybeans | CBOT | 18,846,021 | 7.41% |
| Hard White Winter Wheat | Zhengzhou | 11,587,269 | 20.02% |
| Non-GMO Soybeans | TGE | 9,971,499 | 48.05% |
| Sugar #11 | Nybot | 9,766,550 | 36.77% |
| Rubber | SHFE | 9,680,649 | -63.82% |
| Strong Gluten Wheat | Zhengzhou | 9,655,959 | -36.70% |
| Soybean Meal | CBOT | 8,569,243 | 5.04% |
Largest Changes in Individual Contract Volume
(net of individual equities)
GAINS (in millions)
| Rank | Contract | 2004 | 2003 | Change | % Change |
| 1 | 3-Month Eurodollar Futures, CME | 297.58 | 208.77 | 88.81 | 42.54% |
| 2 | 10-Year T-Note Futures, CBOT | 196.12 | 146.75 | 49.37 | 33.65% |
| 3 | TIIE 28 Futures, MexDer | 206.03 | 162.08 | 43.95 | 27.12% |
| 4 | Interest Rate Futures, BM&F | 100.29 | 57.64 | 42.65 | 73.99% |
| 5 | 5-Year T-Note Futures, CBOT | 105.47 | 73.75 | 31.72 | 43.02% |
| 6 | 3-Month Eurodollar Options, CME | 130.60 | 100.82 | 29.77 | 29.53% |
| 7 | TAIEX Options, Taifex | 43.82 | 21.72 | 22.10 | 101.77% |
| 8 | 3-Month Euribor Futures, Euronext.liffe | 157.75 | 137.69 | 20.05 | 14.56% |
| 9 | 10-Year T-Note Options, CBOT | 56.88 | 41.17 | 15.71 | 38.17% |
| 10 | E-Mini Russell 2000 Futures, CME | 17.12 | 3.88 | 13.24 | 341.39% |
DECLINES (in millions)
| Rank | Contract | 2004 | 2003 | Change | % Change |
| 1 | KOSPI 200 Options, Kofex | 2,521.56 | 2,837.72 | -316.17 | -11.14% |
| 2 | Rubber Futures, Shanghai Futures Exchange | 9.68 | 26.76 | -17.08 | -63.82% |
| 3 | Eurodollar Futures, SGX | 8.24 | 18.80 | -10.56 | -56.17% |
| 4 | CAC 40 Index Options, Euronext.liffe | 63.15 | 73.67 | -10.52 | -14.27% |
| 5 | Gold Futures, Tocom | 17.39 | 26.64 | -9.25 | -34.73% |
| 6 | CETE 91 Futures, MexDer | 2.42 | 11.40 | -8.98 | -78.78% |
| 7 | KOSPI 200 Futures, Kofex | 55.61 | 62.20 | -6.60 | -10.60% |
| 8 | Strong Gluten Wheat, Zhengzhou | 9.66 | 15.25 | -5.60 | -36.70% |
| 9 | 3-Month Euribor Options, Euronext.liffe | 52.25 | 57.73 | -5.49 | -9.51% |
| 10 | CAC 40 10 Euro Futures, Euronext.liffe | 24.06 | 29.32 | -5.26 | -17.94% |
Global Futures and Options Volume by Exchange
|
2004 |
2003 |
Exchange | 2004 Volume | 2003 Volume | % Change |
| 1 | 1 | KOREA FUTURES EXCHANGE | 2,586,818,602 | 2,912,894,034 | -11.2% |
| 2 | 2 | EUREX | 1,065,639,010 | 1,014,932,312 | 5.0% |
| 3 | 4 | CHICAGO MERCANTILE EXCHANGE | 805,341,681 | 640,209,634 | 25.8% |
| 4 | 3 | EURONEXT.LIFFE | 790,381,989 | 694,970,981 | 13.7% |
| 5 | 5 | CHICAGO BOARD OF TRADE | 599,994,386 | 454,190,749 | 32.1% |
| 6 | 6 | CHICAGO BOARD OPTIONS EXCHANGE | 361,086,774 | 283,946,495 | 27.2% |
| 7 | 7 | INTERNATIONAL SECURITIES EXCHANGE | 360,852,519 | 244,968,190 | 47.3% |
| 8 | 9 | BOVESPA | 235,349,514 | 177,223,140 | 32.8% |
| 9 | 10 | MEXICAN DERIVATIVES EXCHANGE | 210,395,264 | 173,820,944 | 21.0% |
| 10 | 8 | AMERICAN STOCK EXCHANGE | 202,680,929 | 180,074,778 | 12.6% |
| 11 | 12 | BOLSA DE MERCADORIAS & FUTUROS | 183,427,938 | 120,785,602 | 51.9% |
| 12 | 11 | NEW YORK MERCANTILE EXCHANGE | 161,103,746 | 137,225,439 | 17.4% |
| 13 | 13 | PHILADELPHIA STOCK EXCHANGE | 133,401,278 | 112,705,597 | 18.4% |
| 14 | 15 | PACIFIC EXCHANGE | 103,262,458 | 86,152,637 | 19.9% |
| 15 | 17 | OMX EXCHANGES | 94,382,633 | 74,105,690 | 27.4% |
| 16 | 16 | DALIAN COMMODITY EXCHANGE | 88,034,153 | 74,973,493 | 17.4% |
| 17 | 21 | NATIONAL STOCK EXCHANGE OF INDIA | 75,093,629 | 43,081,968 | 74.3% |
| 18 | 14 | THE TOKYO COMMODITY EXCHANGE | 74,511,734 | 87,252,219 | -14.6% |
| 19 | 18 | LONDON METAL EXCHANGE | 71,906,901 | 72,308,327 | -0.6% |
| 20 | 27 | TAIWAN FUTURES EXCHANGE | 64,973,429 | 31,874,934 | 103.8% |
| 21 | 20 | SYDNEY FUTURES EXCHANGE | 53,969,445 | 44,755,340 | 20.6% |
| 23 | 23 | TEL-AVIV STOCK EXCHANGE | 43,375,943 | 38,098,479 | 13.9% |
| 24 | 22 | SHANGHAI FUTURES EXCHANGE | 40,577,373 | 40,079,750 | 1.2% |
| 25 | 26 | JSE SECURITIES EXCHANGE SOUTH AFRICA | 38,347,861 | 33,001,743 | 16.2% |
| 26 | 25 | INTERNATIONAL PETROLEUM EXCHANGE | 35,540,783 | 33,341,244 | 6.6% |
| 27 | 28 | CENTRAL JAPAN COMMODITY EXCHANGE | 33,193,259 | 31,538,530 | 5.2% |
| 28 | 30 | OSAKA SECURITIES EXCHANGE | 32,626,063 | 28,235,033 | 15.6% |
| 29 | 32 | NEW YORK BOARD OF TRADE | 31,729,591 | 24,832,158 | 27.8% |
| 30 | 29 | MEFF | 28,740,102 | 31,471,330 | -8.7% |
| 31 | 24 | SINGAPORE EXCHANGES | 28,418,757 | 35,648,224 | -20.3% |
| 32 | 33 | TOKYO GRAIN EXCHANGE | 25,744,922 | 21,120,468 | 21.9% |
| 33 | 31 | ZHENGZHOU COMMODITY EXCHANGE | 24,237,274 | 24,908,899 | -2.7% |
| 34 | 35 | BOURSE DE MONTREAL | 21,815,128 | 17,682,999 | 23.4% |
| 35 | N/A | BOSTON OPTIONS EXCHANGE | 20,741,271 | N/A | |
| 36 | 37 | AUSTRALIAN STOCK EXCHANGE | 20,485,729 | 16,902,205 | 21.2% |
| 37 | 38 | HONG KONG EXCHANGES & CLEARING | 19,629,692 | 14,546,213 | 34.9% |
| 38 | 36 | TOKYO STOCK EXCHANGE | 19,612,565 | 17,035,830 | 15.1% |
| 39 | 34 | ITALIAN DERIVATIVES MARKET | 18,272,516 | 17,731,994 | 3.0% |
| 40 | 46 | MERCADO A TERMINO DE ROSARIO | 8,163,545 | 2,842,496 | 187.2% |
| 41 | 41 | TOKYO INTERNATIONAL FINANCIAL FUTURES EXCHANGE | 7,657,510 | 4,771,917 | 60.5% |
| 42 | N/A | EUREX US | 6,186,808 | N/A | |
| 43 | 42 | OSLO STOCK EXCHANGE | 5,351,734 | 3,823,814 | 40.0% |
| 44 | 40 | BUDAPEST STOCK EXCHANGE | 4,252,595 | 4,939,893 | -13.9% |
| 45 | 39 | OSAKA MERCANTILE EXCHANGE | 3,842,553 | 6,162,589 | -37.6% |
| 46 | 45 | KANSAS CITY BOARD OF TRADE | 3,089,103 | 3,099,805 | -0.3% |
| 47 | 47 | FUKUOKA FUTURES EXCHANGE | 3,036,733 | 2,739,383 | 10.9% |
| 48 | 44 | KANSAI COMMODITIES EXCHANGE | 2,806,740 | 3,444,296 | -18.5% |
| 49 | 48 | MALAYSIA DERIVATIVES EXCHANGE BERHAD | 2,632,543 | 2,009,460 | 31.0% |
| 50 | 52 | WIENER BORSE | 2,242,475 | 1,392,529 | 61.0% |
| 51 | 50 | WINNIPEG COMMODITY EXCHANGE | 2,054,296 | 1,842,776 | 11.5% |
| 52 | 51 | ONECHICAGO | 1,922,726 | 1,619,194 | 18.7% |
| 53 | 54 | MINNEAPOLIS GRAIN EXCHANGE | 1,416,282 | 1,133,731 | 24.9% |
| 54 | 43 | BUDAPEST COMMODITY EXCHANGE | 1,300,726 | 3,673,978 | -64.6% |
| 55 | 49 | YOKOHAMA COMMODITY EXCHANGE | 1,164,811 | 1,852,158 | -37.1% |
| 56 | 56 | COPENHAGEN STOCK EXCHANGE | 704,006 | 762,050 | -7.6% |
| 57 | 57 | NEW ZEALAND FUTURES EXCHANGE | 497,181 | 493,250 | 0.8% |
| 58 | 55 | NQLX | 257,000 | 858,900 | -70.1% |
| 59 | N/A | CBOE FUTURES EXCHANGE | 91,332 | N/A | |
| 60 | 59 | MERCADO A TERMINO DE BUENOS AIRES | 85,593 | 39,610 | 116.1% |
| 61 | 53 | BROKERTEC FUTURES EXCHANGE | 1,356,825 | N/A | |
| N/A | 58 | MIDAMERICA COMMODITY EXCHANGE | N/A | 142,298 | N/A |
Top 40 Futures Exchanges
(Volume figures do not include options on futures)
| 2004 Rank |
2003 Rank |
2004 Volume | 2003 Volume | % Change | |
| 1 | 1 | EUREX | 684,630,502 | 668,650,028 | 2.4% |
| 2 | 2 | CHICAGO MERCANTILE EXCHANGE | 664,884,607 | 530,989,007 | 25.2% |
| 3 | 3 | CHICAGO BOARD OF TRADE | 489,230,144 | 373,669,290 | 30.9% |
| 4 | 4 | EURONEXT.LIFFE | 310,673,375 | 267,822,143 | 16.0% |
| 5 | 5 | MEXICAN DERIVATIVES EXCHANGE | 210,355,031 | 173,820,944 | 21.0% |
| 6 | 6 | BOLSA DE MERCADORIAS & FUTUROS | 173,533,508 | 113,895,061 | 52.4% |
| 7 | 7 | NEW YORK MERCANTILE EXCHANGE | 133,284,248 | 111,789,658 | 19.2% |
| 8 | 10 | DALIAN COMMODITY EXCHANGE | 88,034,153 | 74,973,493 | 17.4% |
| 9 | 8 | THE TOKYO COMMODITY EXCHANGE | 74,447,426 | 87,252,219 | -14.7% |
| 10 | 14 | NATIONAL STOCK EXCHANGE OF INDIA | 67,406,562 | 36,141,561 | 86.5% |
| 11 | 11 | LONDON METAL EXCHANGE | 67,171,973 | 68,570,154 | -2.0% |
| 12 | 9 | KOREA FUTURES EXCHANGE | 65,261,326 | 75,159,690 | -13.2% |
| 13 | 12 | SYDNEY FUTURES EXCHANGE | 50,968,901 | 41,831,862 | 21.8% |
| 14 | 13 | SHANGHAI FUTURES EXCHANGE | 40,577,373 | 40,079,750 | 1.2% |
| 15 | 16 | INTERNATIONAL PETROLEUM EXCHANGE | 35,466,941 | 33,258,385 | 6.6% |
| 16 | 17 | CENTRAL JAPAN COMMODITY EXCHANGE | 33,193,259 | 31,538,530 | 5.2% |
| 17 | 15 | SINGAPORE EXCHANGES | 28,169,379 | 35,356,776 | -20.3% |
| 18 | 19 | OMX EXCHANGES | 27,264,123 | 24,315,286 | 12.1% |
| 19 | 20 | TOKYO GRAIN EXCHANGE | 25,705,687 | 21,084,727 | 21.9% |
| 20 | 18 | ZHENGZHOU COMMODITY EXCHANGE | 24,237,274 | 24,908,899 | -2.7% |
| 21 | 21 | NEW YORK BOARD OF TRADE | 23,955,212 | 18,822,048 | 27.3% |
| 22 | 24 | JSE SECURITIES EXCHANGE SOUTH AFRICA | 19,811,664 | 14,947,523 | 32.5% |
| 23 | 23 | TOKYO STOCK EXCHANGE | 18,331,928 | 15,965,175 | 14.8% |
| 24 | 22 | MEFF | 17,592,259 | 17,110,745 | 2.8% |
| 25 | 27 | TAIWAN FUTURES EXCHANGE | 14,911,839 | 9,953,118 | 49.8% |
| 26 | 25 | OSAKA SECURITIES EXCHANGE | 14,583,283 | 13,231,287 | 10.2% |
| 27 | 26 | BOURSE DE MONTREAL | 12,900,821 | 10,676,279 | 20.8% |
| 28 | 28 | HONG KONG EXCHANGES & CLEARING | 11,884,152 | 8,174,652 | 45.4% |
| 29 | 35 | MERCADO A TERMINO DE ROSARIO | 7,735,890 | 2,708,313 | 185.6% |
| 30 | 32 | TOKYO INTERNATIONAL FINANCIAL FUTURES EXCHANGE | 7,655,510 | 4,771,917 | 60.4% |
| 31 | 29 | ITALIAN DERIVATIVES MARKET | 6,551,211 | 7,302,565 | -10.3% |
| 32 | 40 | EUREX US | 6,186,008 | N/A | |
| 33 | 31 | BUDAPEST STOCK EXCHANGE | 4,252,595 | 4,939,893 | -13.9% |
| 34 | 30 | OSAKA MERCANTILE EXCHANGE | 3,842,553 | 6,162,589 | -37.6% |
| 35 | 34 | FUKUOKA FUTURES EXCHANGE | 3,036,733 | 2,739,383 | 10.9% |
| 36 | 36 | KANSAS CITY BOARD OF TRADE | 2,834,799 | 2,634,424 | 7.6% |
| 37 | 33 | KANSAI COMMODITIES EXCHANGE | 2,803,812 | 3,441,365 | -18.5% |
| 38 | 37 | MALAYSIA DERIVATIVES EXCHANGE BERHAD | 2,632,543 | 2,009,460 | 31.0% |
| 39 | 38 | WINNIPEG COMMODITY EXCHANGE | 2,030,455 | 1,811,616 | 12.1% |
| 40 | 39 | ONECHICAGO | 1,922,726 | 1,619,194 | 18.7% |